Run 1772762787
- Date (UTC):
2026-03-06 02:06:27Z - Benchmark:
b9071a210792c8f19fc7d500828fa16f - Timeout:
2h
Trial run
Warning — trial run. This benchmark was executed with fewer than 10 instances per fuzzer and/or a time budget shorter than 24h. Results from trial runs are meant for debugging purposes and are not valid for extracting conclusions across different fuzzers.
Charts
Report
Fuzzer Benchmark Report (from bug-count CSV)
- Time budget: 2.00h
Warning — trial run. This benchmark was executed with fewer than 10 instances per fuzzer and/or a time budget shorter than 24h. Results from trial runs are meant for debugging purposes and are not valid for extracting conclusions across different fuzzers.
Executive summary
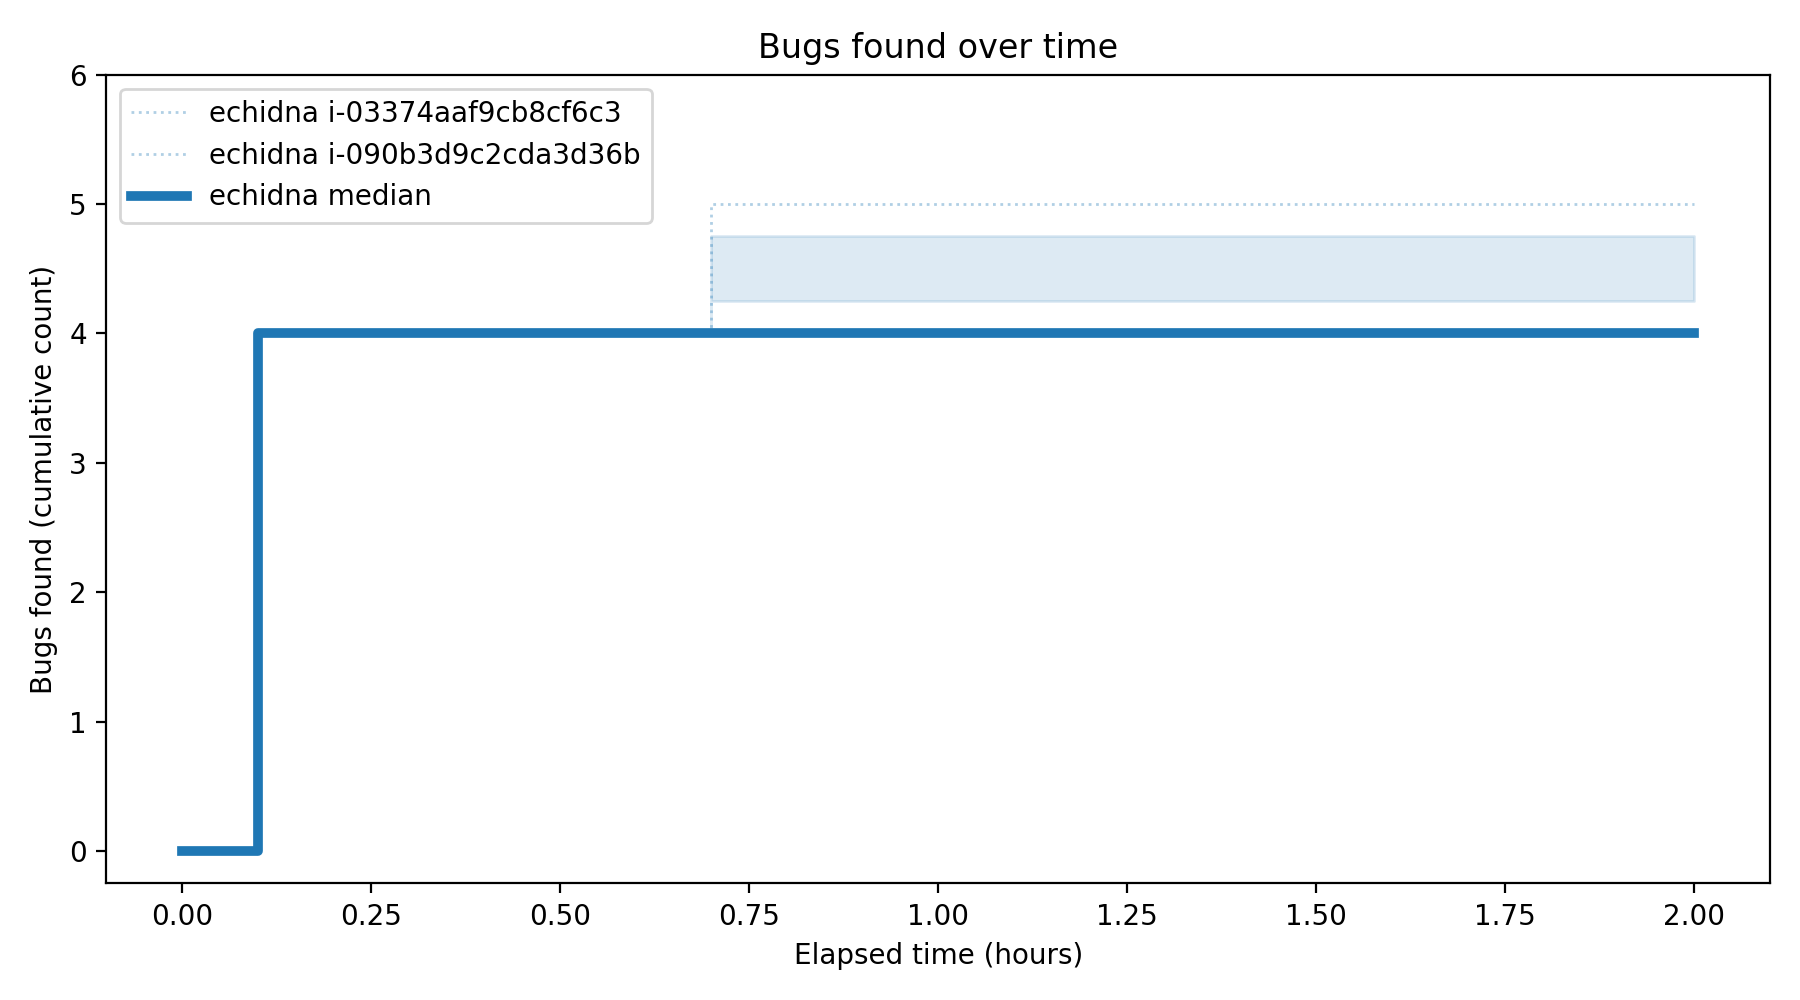
This report is derived solely from cumulative bugs-found over time across repeated runs per fuzzer. It emphasizes robust, distribution-based metrics (median/IQR, success rates, time-to-k) and shape-based behavior (plateau time, late discovery share) instead of single-run time-to-first-bug.
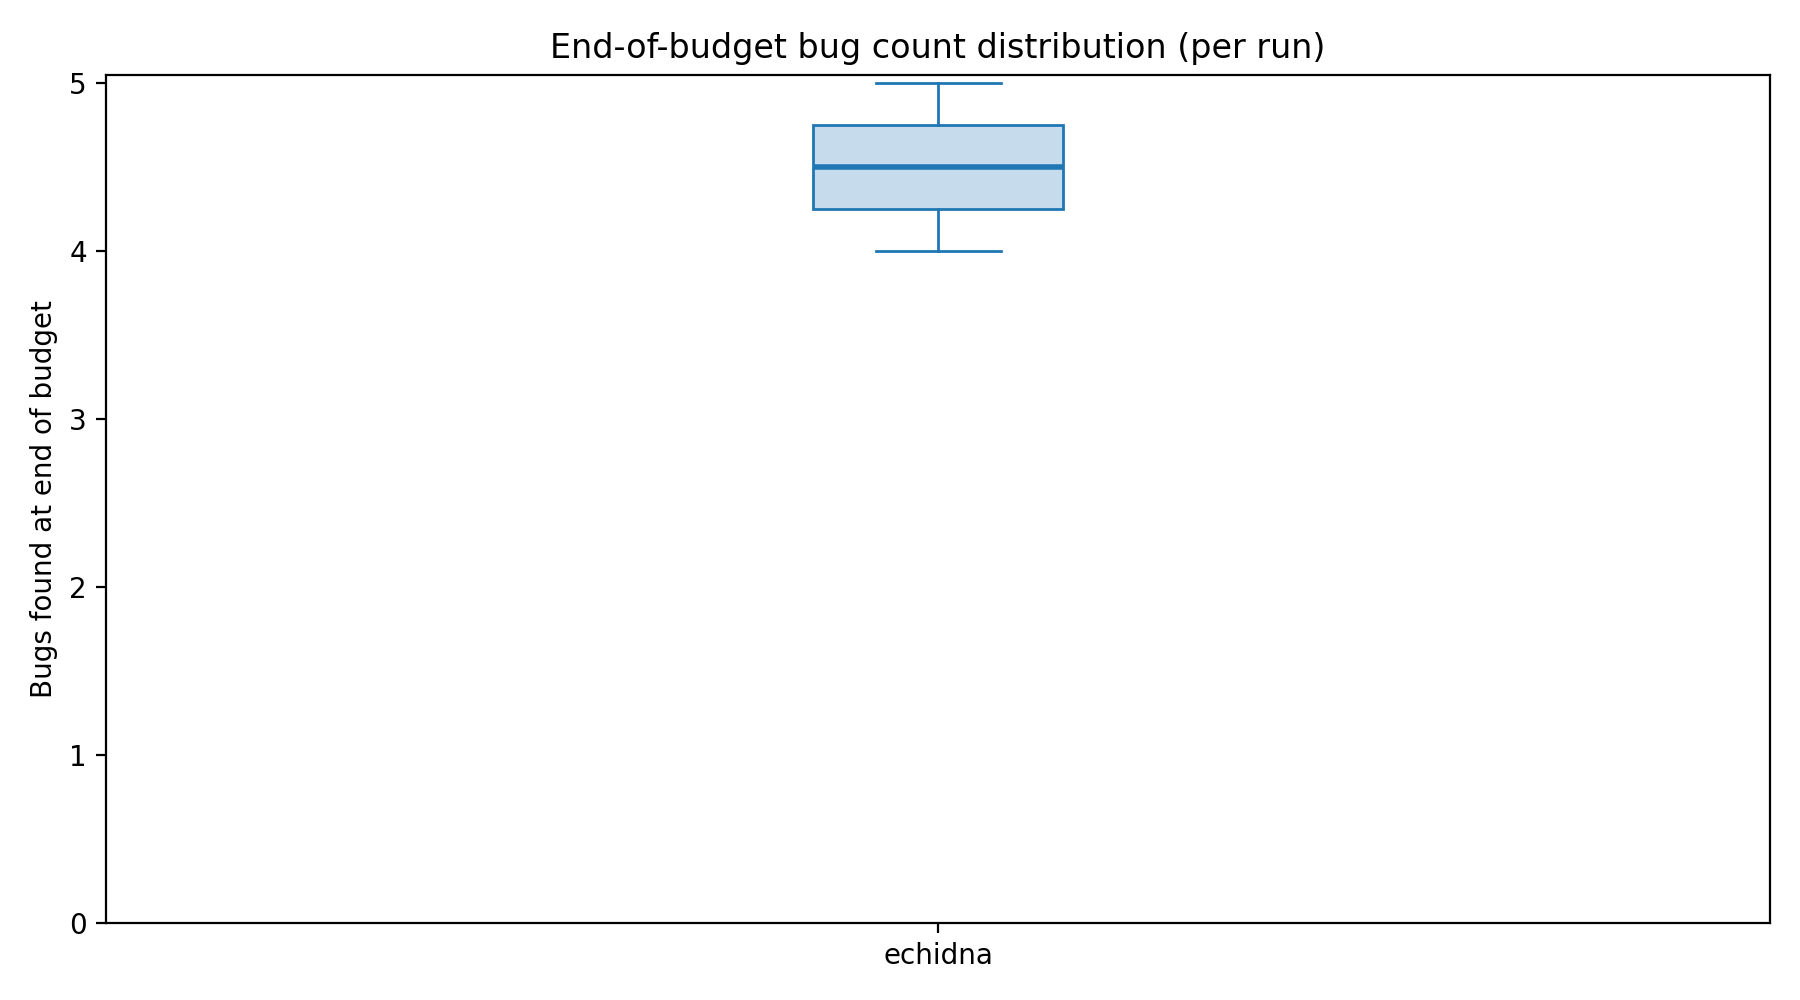
Bugs found at fixed time budgets (median [IQR])
| Fuzzer | Runs | 1h |
|---|---|---|
| echidna | 2 | 4 [4,5] |
Overall metrics
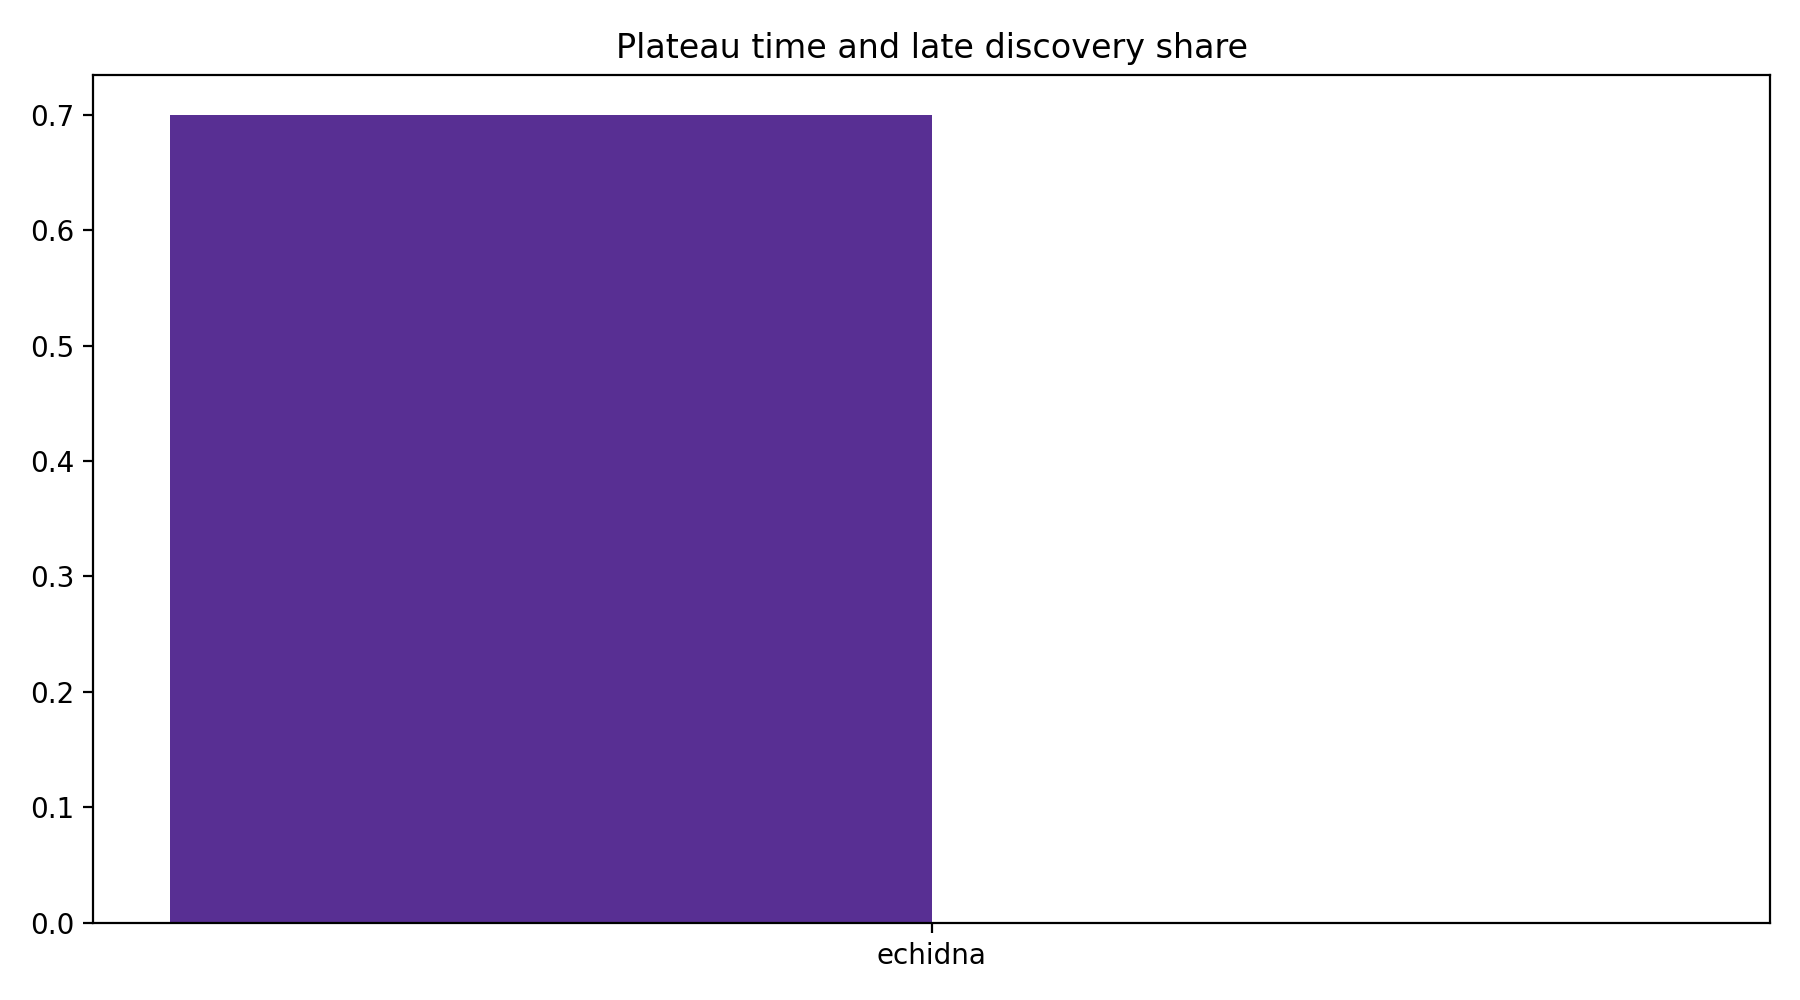
| Fuzzer | AUC (norm) | Plateau time | Late discovery share | Final median | Final IQR |
|---|---|---|---|---|---|
| echidna | 0.825 | 0.70h | 0.000 | 4 | 0.50 |
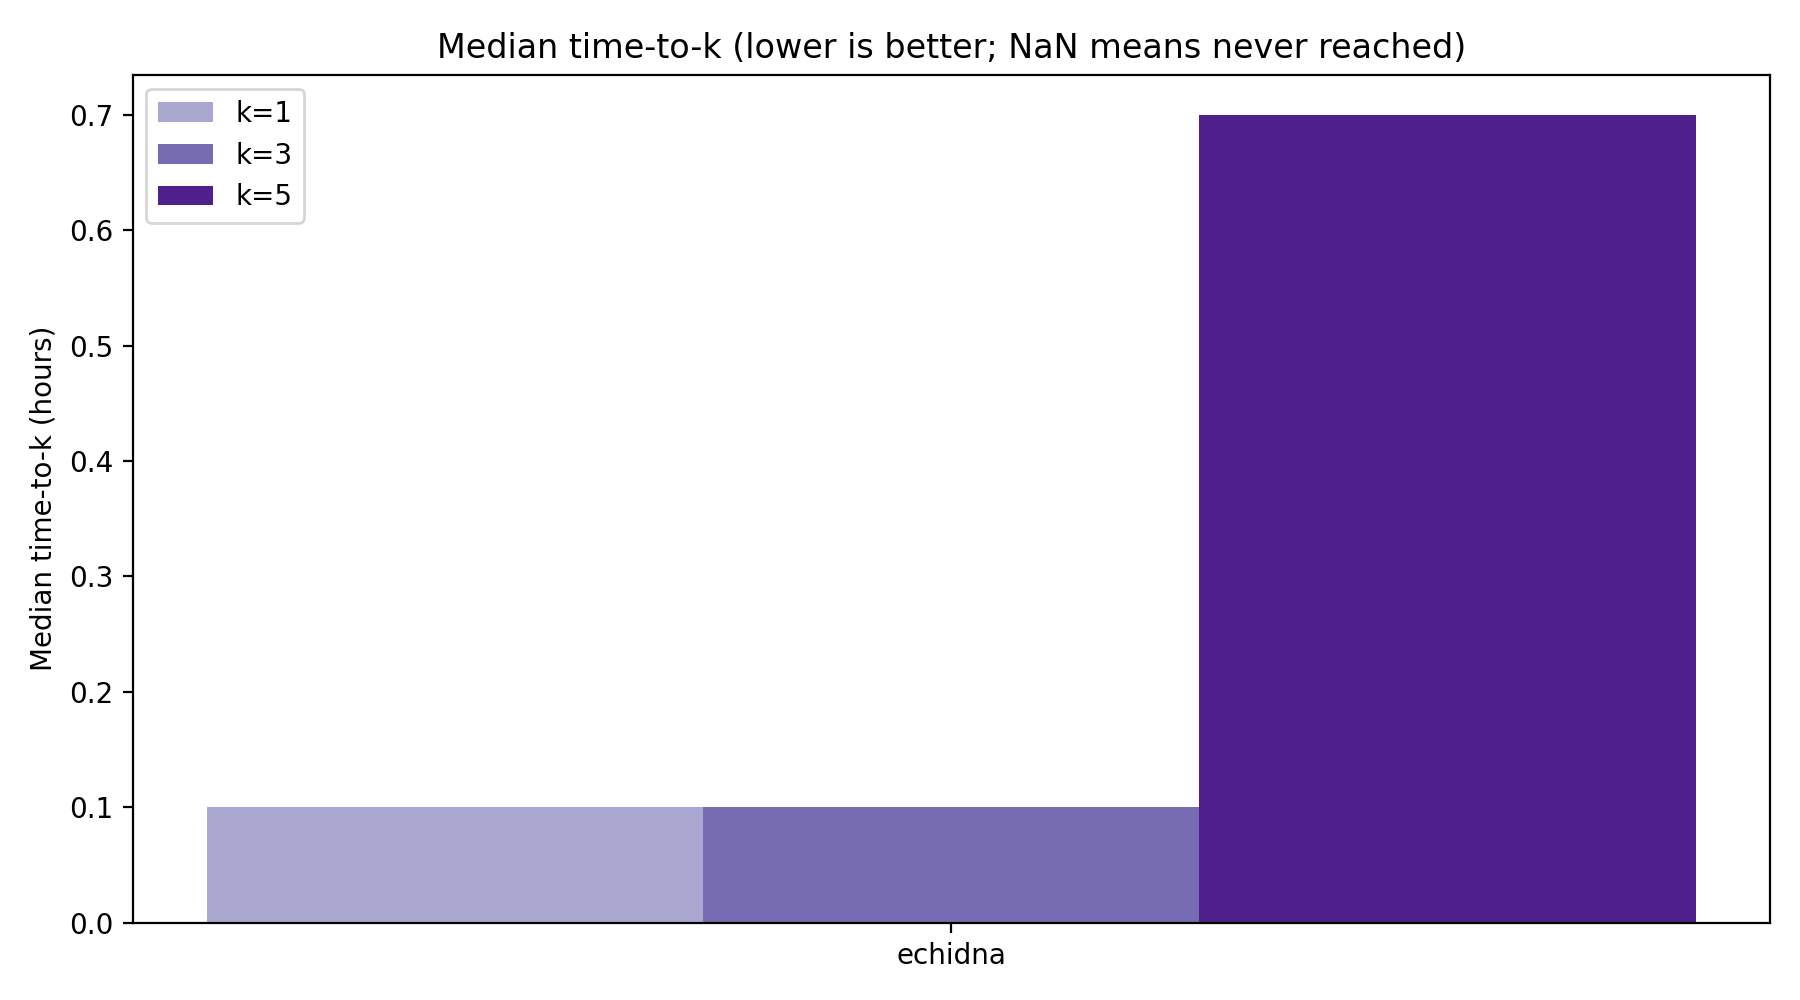
Milestones: time-to-k and success rates
| Fuzzer | time-to-1 (p50) | time-to-3 (p50) | time-to-5 (p50) | reach-1 rate | reach-3 rate | reach-5 rate |
|---|---|---|---|---|---|---|
| echidna | 0.10h | 0.10h | 0.70h | 100.0% | 100.0% | 50.0% |
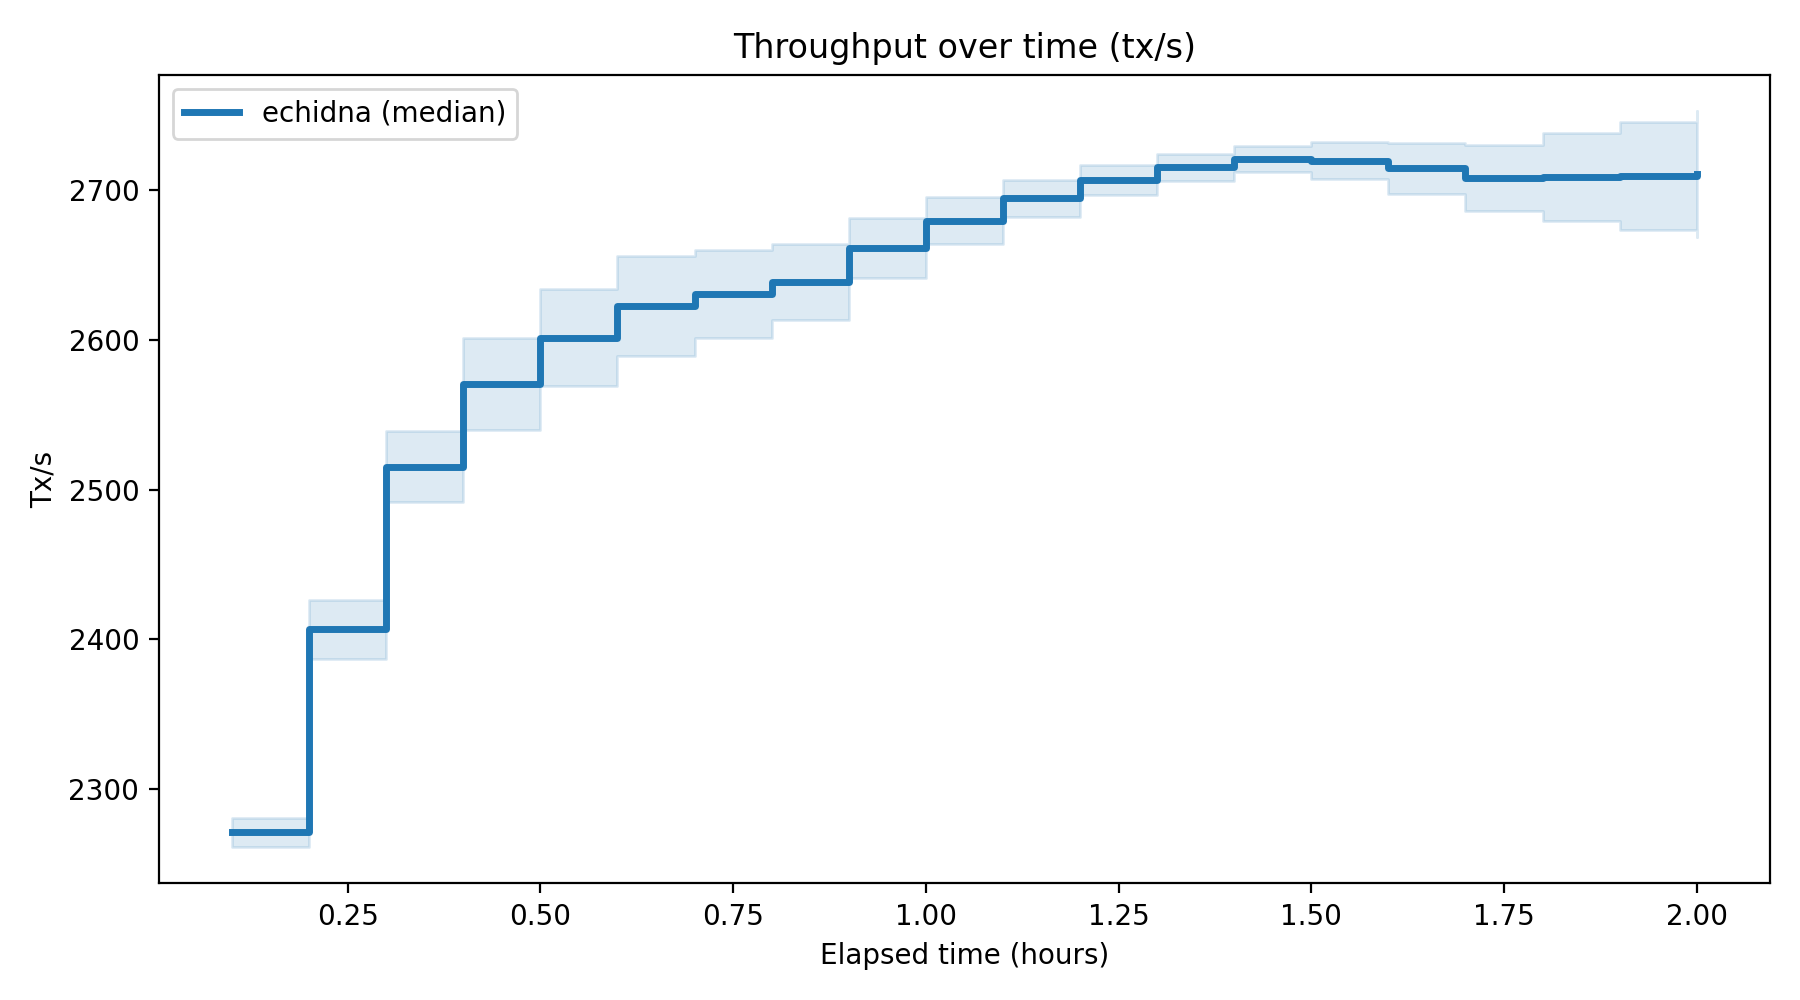
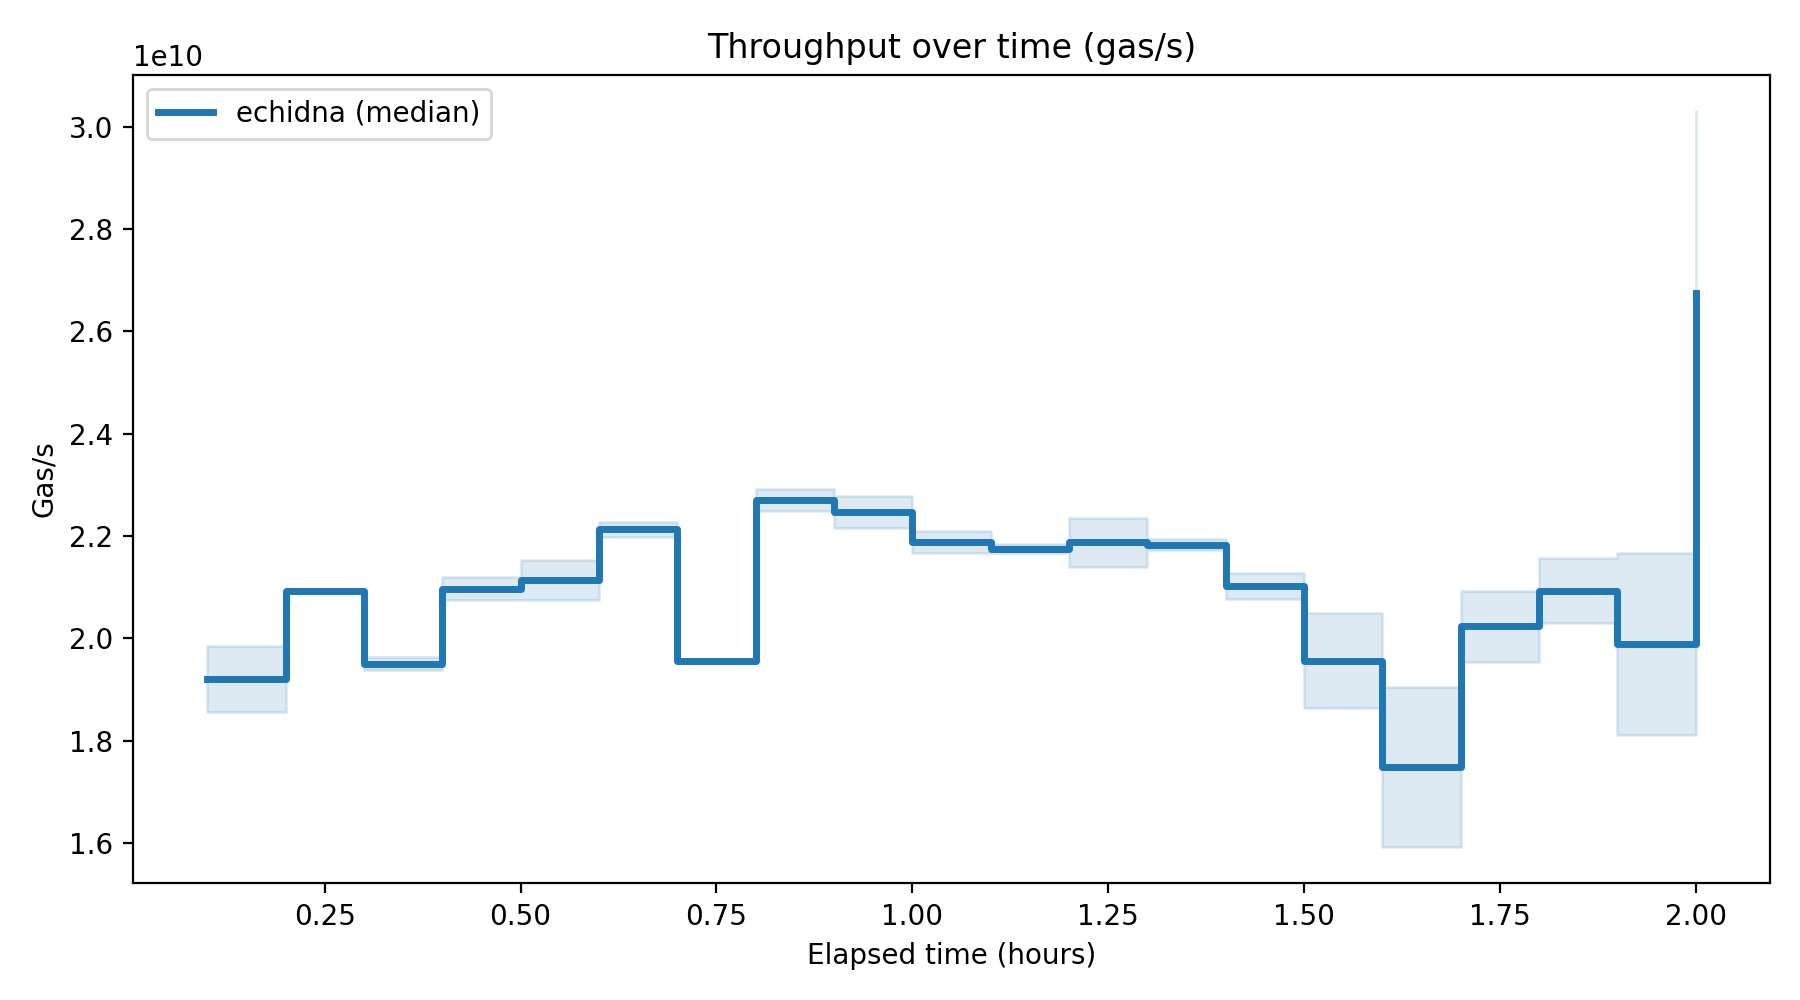
Throughput metrics (if supported by log format)
Values are run-level rates aggregated per fuzzer; n/a indicates the parser could not recover that metric from logs.
| Fuzzer | Runs | Tx/s runs | Tx/s p50 [p25,p75] | Gas/s runs | Gas/s p50 [p25,p75] |
|---|---|---|---|---|---|
| echidna | 2 | 2 | 2710.59 [2668.56,2752.61] | 2 | 26744484414.00 [23189305747.00,30299663081.00] |
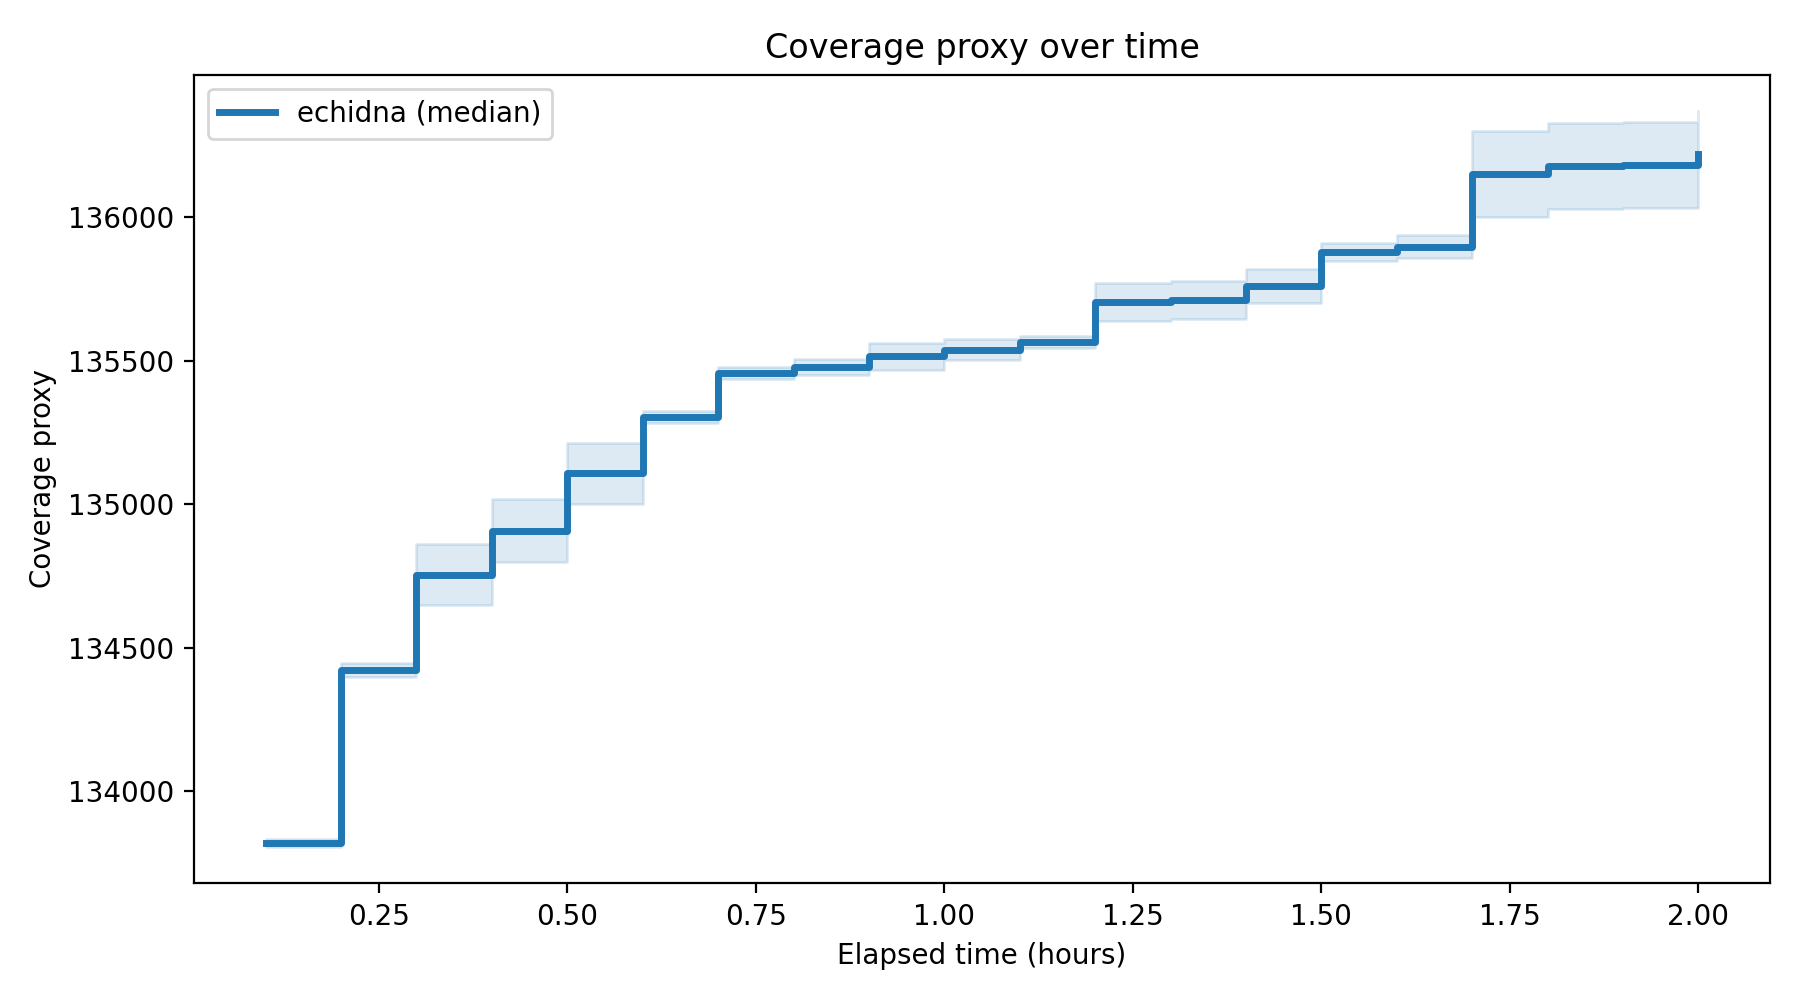
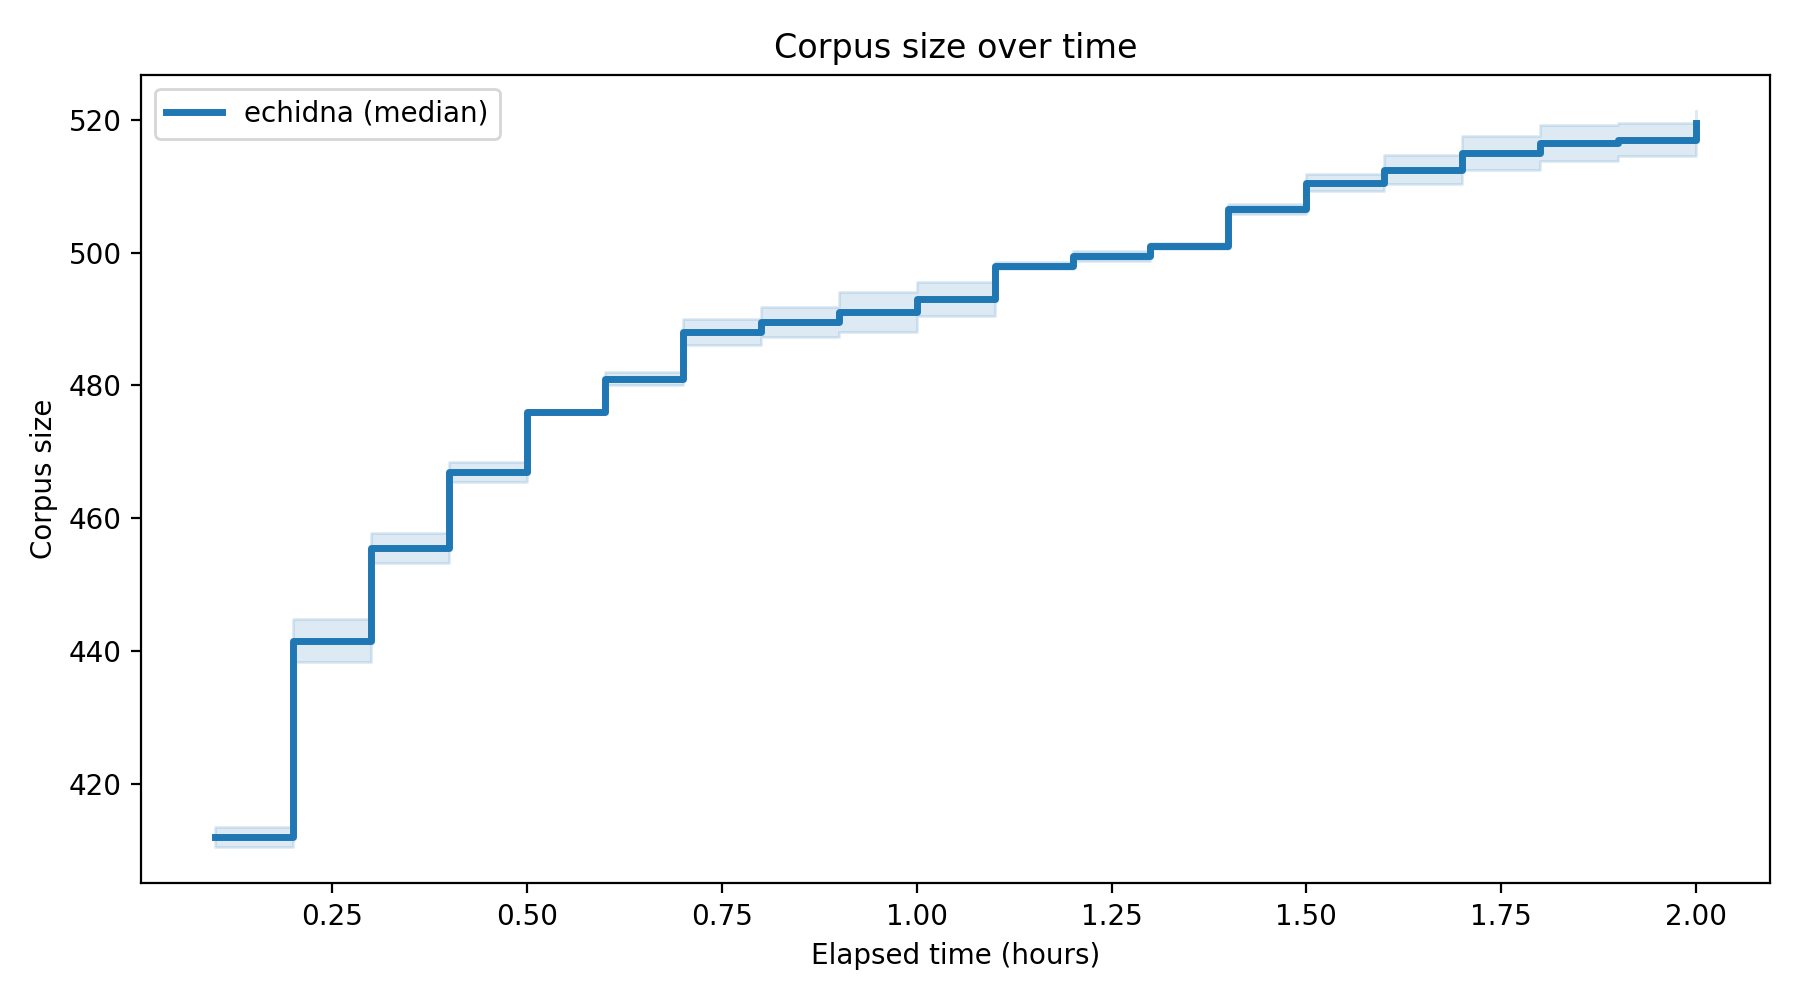
Progress metrics from logs (fuzzer-specific proxies)
Coverage/corpus values are parsed from each fuzzer's native progress output and are useful for trend context, not strict cross-fuzzer equivalence.
| Fuzzer | Runs | Seq/s runs | Seq/s p50 [p25,p75] | Coverage runs | Coverage p50 [p25,p75] | Corpus runs | Corpus p50 [p25,p75] |
|---|---|---|---|---|---|---|---|
| echidna | 2 | 0 | n/a | 2 | 136222.00 [136075.00,136369.00] | 2 | 519.50 [517.75,521.25] |
Statistical comparison (Mann-Whitney U test)
Pairwise Mann-Whitney U tests on end-of-budget bug counts (two-sided). Bonferroni correction applied for 0 comparison(s). Significance level: alpha = 0.05.
Warnings:
- Only one fuzzer present; skipping pairwise statistical tests.
Note: The Mann-Whitney U test assesses whether one fuzzer tends to find more bugs than another across runs. It does not measure effect size or practical importance. Small sample sizes (fewer than 5 runs) reduce statistical power.
Shape-based interpretation (rules of thumb)
- Fast-start / early-plateau: high early checkpoint median + early plateau time + low late discovery share.
- Steady: moderate AUC, later plateau, consistent improvements across checkpoints, moderate variance.
- Slow-burn / late-surge: low early checkpoints but high late discovery share and later plateau time; often higher final median.
Limitations
- Core metrics in this section are count-based; use
broken_invariants.md/broken_invariants.csvfor invariant identities. - Severity, exploitability, and root-cause uniqueness cannot be measured directly without richer per-bug metadata.
- Harness design still affects results; mitigate by keeping harness identical across fuzzers and reporting many runs.
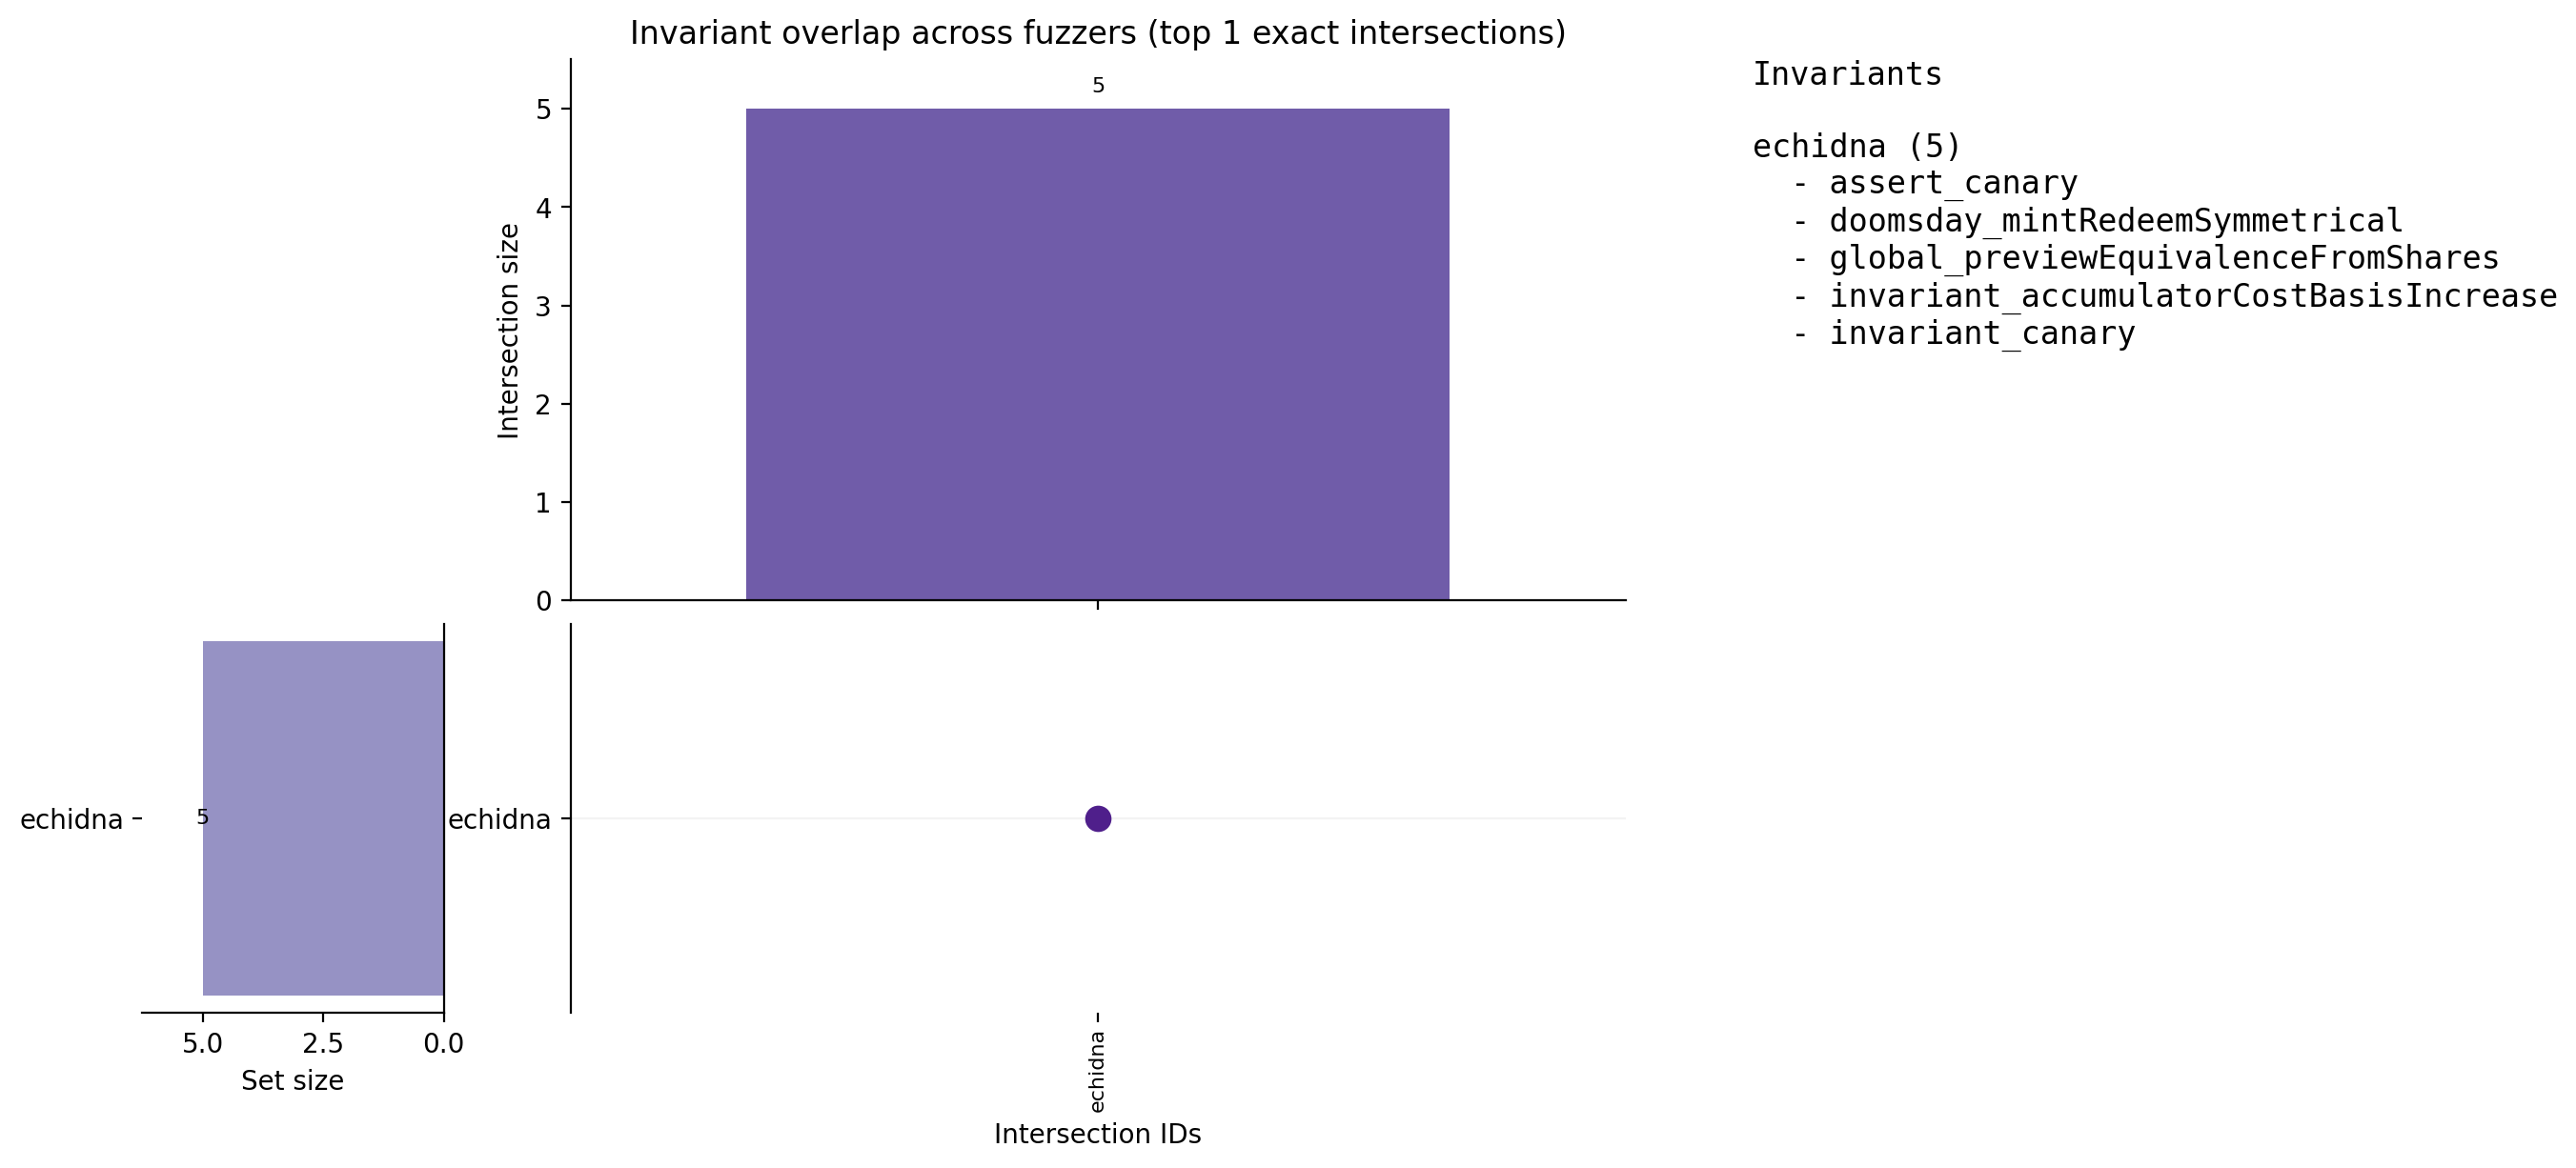
Broken invariants
- Budget filter: 2.00h
- Events considered: 9 / 9
- Unique invariants: 5
Warning — trial run. This benchmark was executed with fewer than 10 instances per fuzzer and/or a time budget shorter than 24h. Results from trial runs are meant for debugging purposes and are not valid for extracting conclusions across different fuzzers.
Per-fuzzer totals
| Fuzzer | Invariants |
|---|---|
| echidna | 5 |
High-level overlap
- Shared by all fuzzers: 5
- Exclusive to
echidna: 5
Grouped invariants
Exclusive to echidna (5)
assert_canarydoomsday_mintRedeemSymmetricalglobal_previewEquivalenceFromSharesinvariant_accumulatorCostBasisIncreaseinvariant_canary
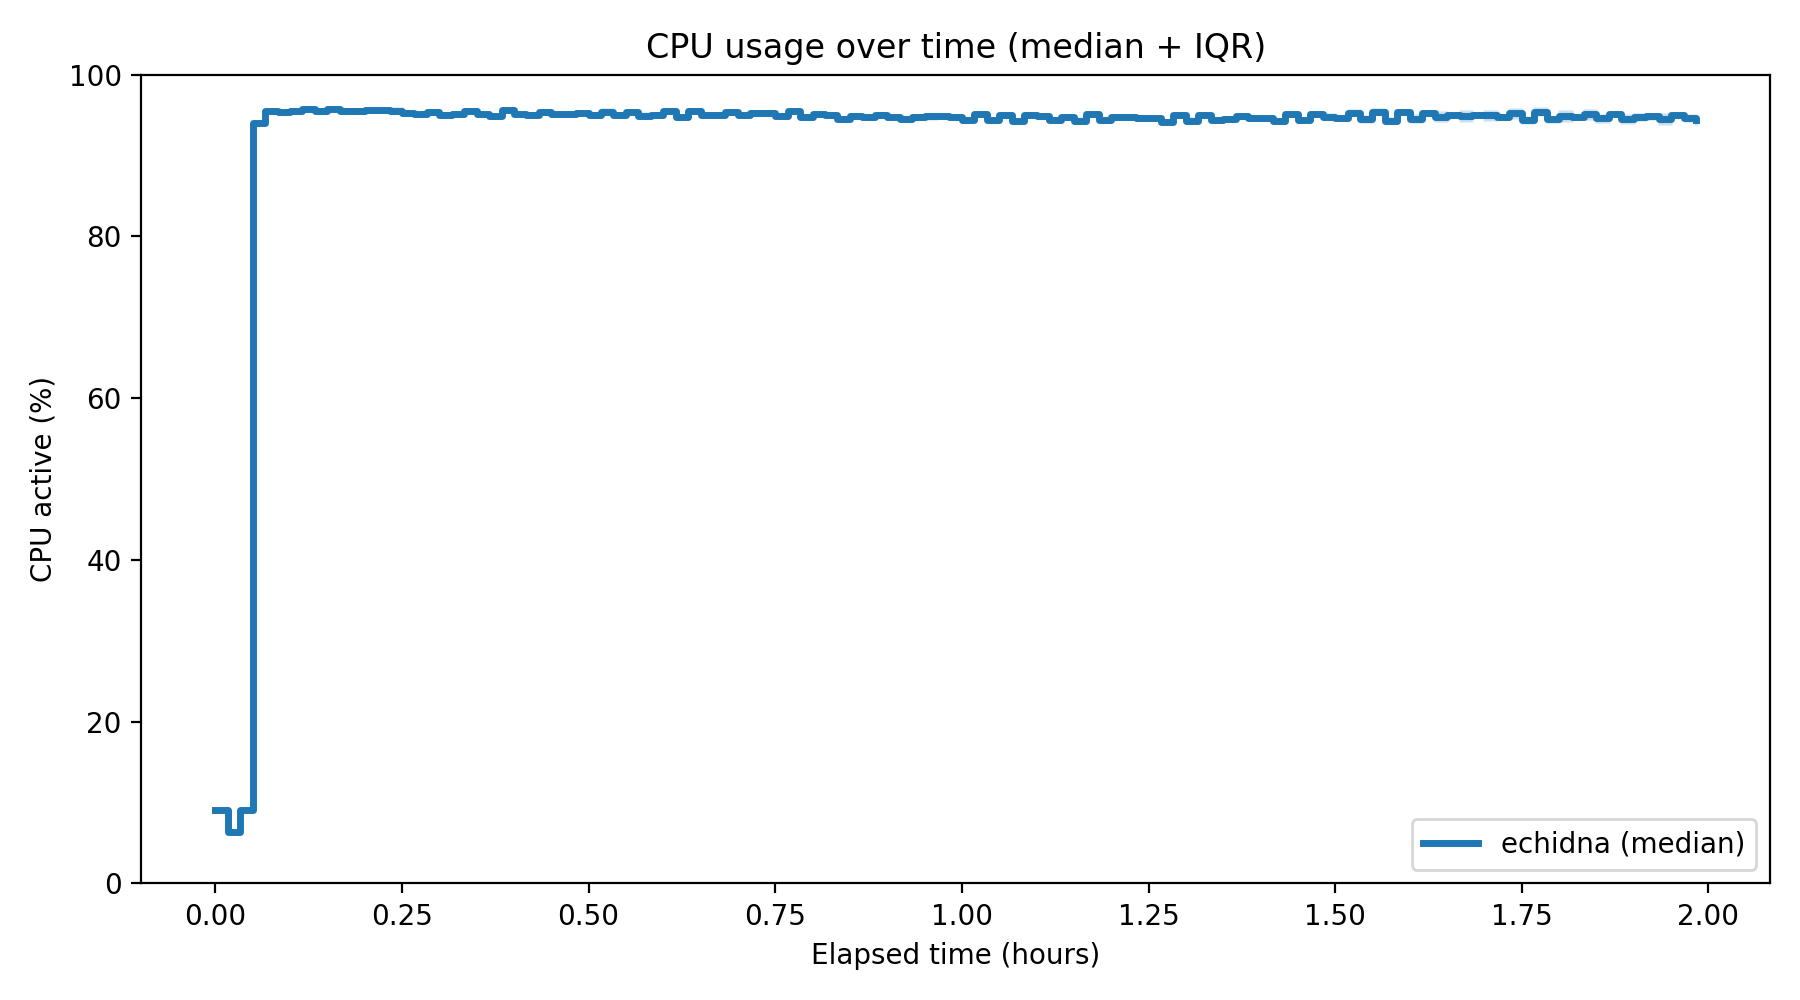
Runner resource usage
- Budget filter: 2.00h
- Instances with metrics: 2
- Total samples: 2852
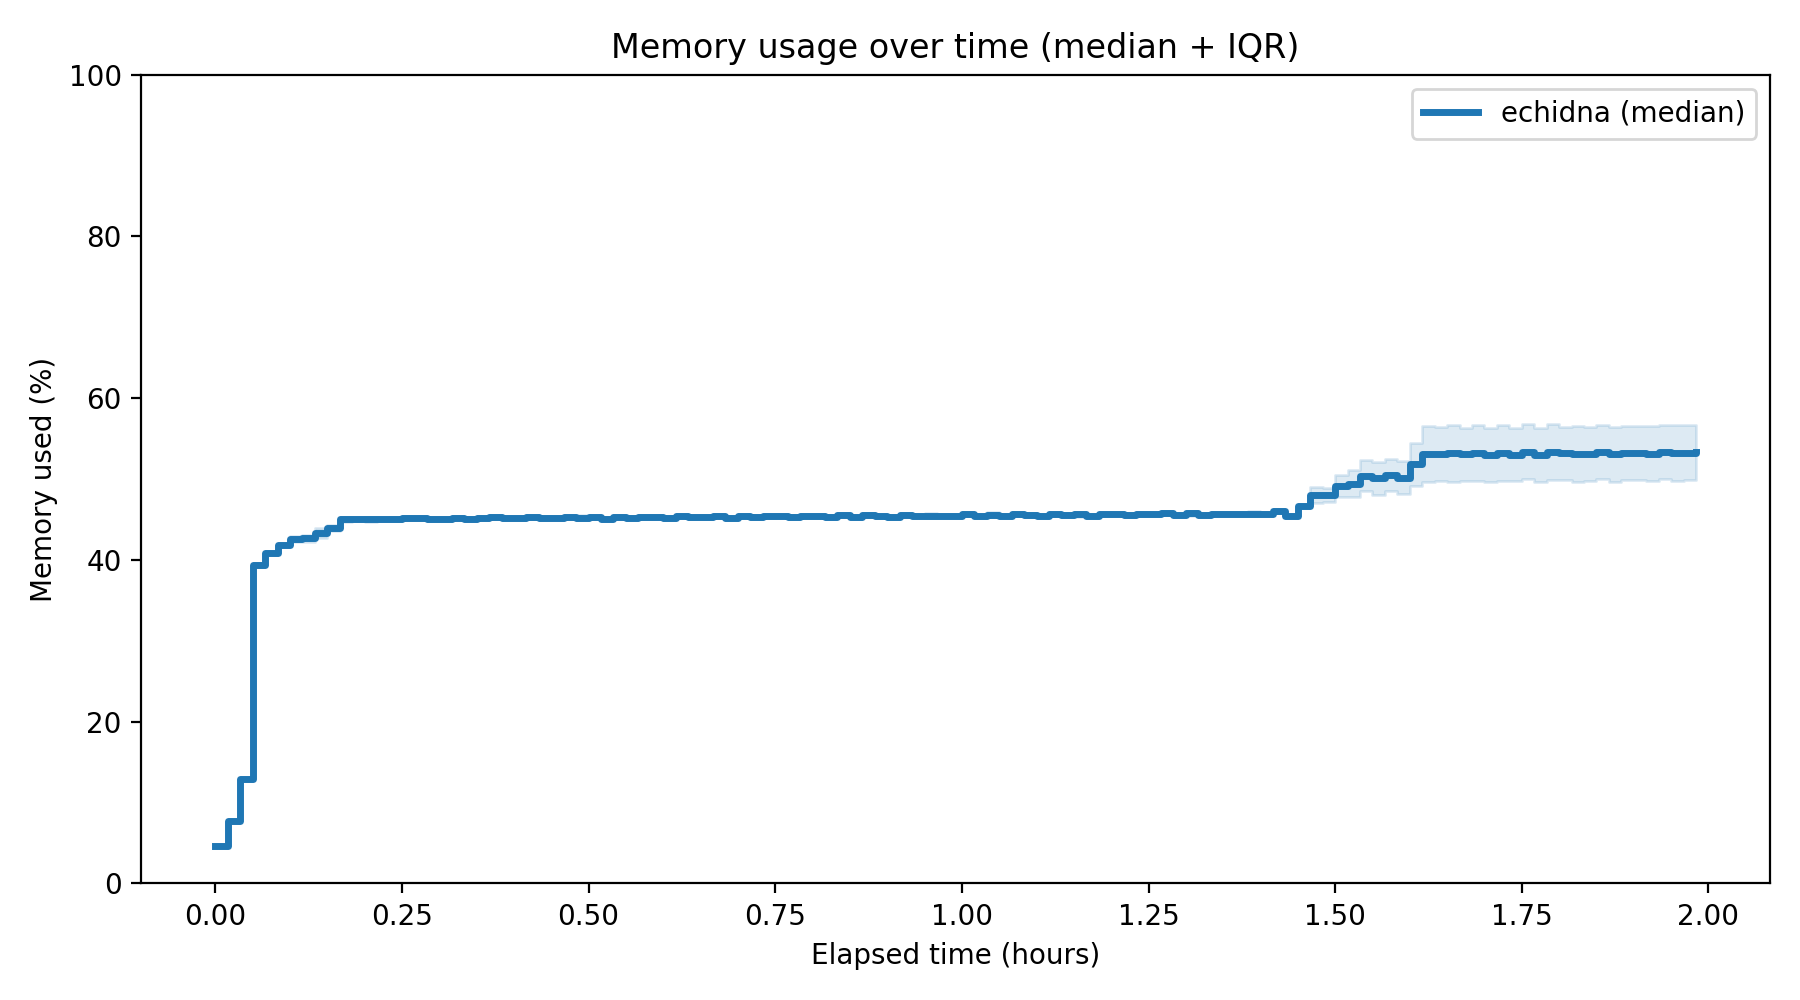
Per-fuzzer medians (across instances)
| Fuzzer | Instances | CPU active avg (%) | CPU active peak (%) | Memory used avg (GiB) | Memory used peak (GiB) | Memory used avg (%) | Memory used peak (%) |
|---|---|---|---|---|---|---|---|
| echidna | 2 | 92.76 | 97.04 | 14.13 | 16.81 | 46.11 | 54.85 |
Instance stats
| Instance | Fuzzer | Samples | Duration (h) | CPU active avg (%) | CPU active peak (%) | Memory avg (GiB) | Memory peak (GiB) | Memory avg (%) | Memory peak (%) |
|---|---|---|---|---|---|---|---|---|---|
| i-03374aaf9cb8cf6c3-echidna-v2.3.1 | echidna | 1426 | 2.00 | 93.06 | 97.29 | 14.53 | 19.03 | 47.41 | 62.10 |
| i-090b3d9c2cda3d36b-echidna-v2.3.1 | echidna | 1426 | 2.00 | 92.46 | 96.79 | 13.73 | 14.59 | 44.80 | 47.60 |
Manifest
- scfuzzbench_commit:
5ff806e1313ed6f641e22280d9b81b88610abb4d - target_repo_url: https://github.com/Recon-Fuzz/superform-v2-periphery-scfuzzbench
- target_commit:
dev-recon - benchmark_type:
property - instance_type:
c6a.4xlarge - instances_per_fuzzer:
2 - timeout_hours:
2 - aws_region:
us-east-1 - ubuntu_ami_id:
ami-0071174ad8cbb9e17 - foundry_version:
v1.6.0-rc1 - foundry_git_repo:
https://github.com/aviggiano/foundry - foundry_git_ref:
master - echidna_version:
2.3.1 - medusa_version:
1.4.1 - fuzzer_keys:
echidna
Artifacts
Manifest (index): https://scfuzzbench-logs-185f44d6.s3.us-east-1.amazonaws.com/runs/1772762787/b9071a210792c8f19fc7d500828fa16f/manifest.json
Report prefix: https://scfuzzbench-logs-185f44d6.s3.us-east-1.amazonaws.com/analysis/b9071a210792c8f19fc7d500828fa16f/1772762787/
Broken invariants (Markdown): https://scfuzzbench-logs-185f44d6.s3.us-east-1.amazonaws.com/analysis/b9071a210792c8f19fc7d500828fa16f/1772762787/broken_invariants.md
Broken invariants (CSV): https://scfuzzbench-logs-185f44d6.s3.us-east-1.amazonaws.com/analysis/b9071a210792c8f19fc7d500828fa16f/1772762787/broken_invariants.csv
Throughput summary (CSV): https://scfuzzbench-logs-185f44d6.s3.us-east-1.amazonaws.com/analysis/b9071a210792c8f19fc7d500828fa16f/1772762787/throughput_summary.csv
Progress metrics summary (CSV): https://scfuzzbench-logs-185f44d6.s3.us-east-1.amazonaws.com/analysis/b9071a210792c8f19fc7d500828fa16f/1772762787/progress_metrics_summary.csv
Runner resource usage (Markdown): https://scfuzzbench-logs-185f44d6.s3.us-east-1.amazonaws.com/analysis/b9071a210792c8f19fc7d500828fa16f/1772762787/runner_resource_usage.md
Runner resource summary (CSV): https://scfuzzbench-logs-185f44d6.s3.us-east-1.amazonaws.com/analysis/b9071a210792c8f19fc7d500828fa16f/1772762787/runner_resource_summary.csv
Runner resource timeseries (CSV): https://scfuzzbench-logs-185f44d6.s3.us-east-1.amazonaws.com/analysis/b9071a210792c8f19fc7d500828fa16f/1772762787/runner_resource_timeseries.csv
Analysis bundle: https://scfuzzbench-logs-185f44d6.s3.us-east-1.amazonaws.com/analysis/b9071a210792c8f19fc7d500828fa16f/1772762787/bundles/analysis.zip
Corpus bundle: https://scfuzzbench-logs-185f44d6.s3.us-east-1.amazonaws.com/analysis/b9071a210792c8f19fc7d500828fa16f/1772762787/bundles/corpus.zip
Raw logs prefix: https://scfuzzbench-logs-185f44d6.s3.us-east-1.amazonaws.com/logs/1772762787/b9071a210792c8f19fc7d500828fa16f/
Raw corpus prefix: https://scfuzzbench-logs-185f44d6.s3.us-east-1.amazonaws.com/corpus/1772762787/b9071a210792c8f19fc7d500828fa16f/